We investigate the landings/catch time series for the Northeast US Shelf Large Marine Ecosystem (NEUS LME). Data sources include:
- Link (2021) uses data from Reg, A Watson (2017)
- Sea around us
- NEFSC database
- NAFO
- Stocksmart
Link paper 2021 vs Sea Around us
In a recent paper, Link (2021) showed a figure depicting catch from the NEUS region from 1950-2014. This catch time series represents all reported catch from every taxa in addition to estimated illegal and unreported landings. The methods of collection and interpolation are referenced in Reg, A Watson (2017)
The Sea around us also provides this data for the same LME and is also broken down by species. The main differences are that reported catch is separated from the estimated total catch (which also includes illegal and unreported catch) and the methods of collection and interpolation. The area of the defined LME is 278780 km2.
- Clear differences between data sets trends from late 60’s though 70s
- Otherwise similar trends from 80s onward.
- The SAU estimates of total catch are approximately 10% higher than of Link (post 1980)
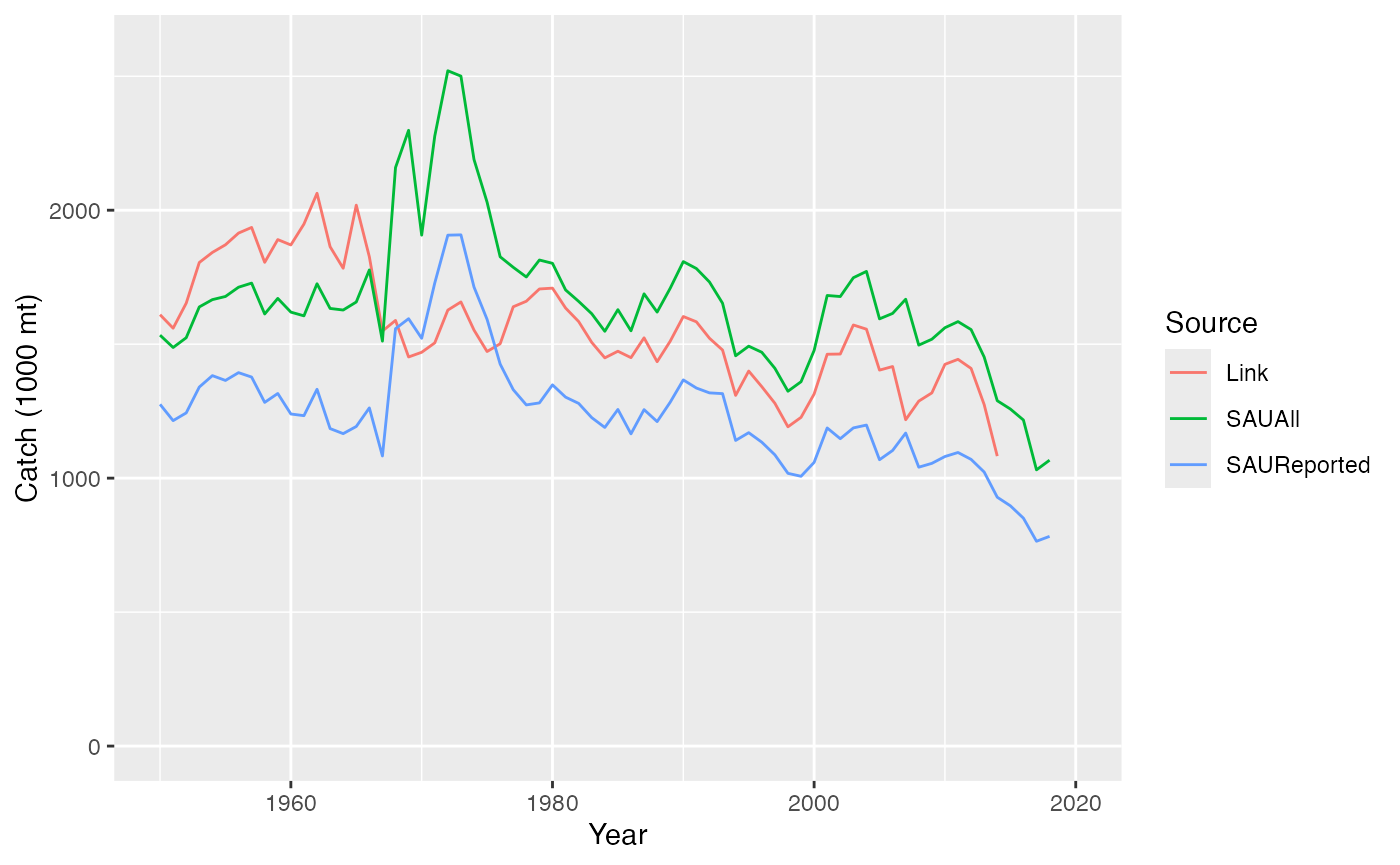
Mean percentage increase from reported catch (SAUReported) to total estimate (SAUAll) = 25.2472791 %
SAU data is approximately 10.4996812 % higher than Link
NEFSC database
The northeast fisheries science center houses commercial fishing data
internally. This data is used in stock assessments. The R package
comlandr provides an interface for easily pulling this
data. comlandr also pulls foreign data from the NAFO
website to obtain estimates of foreign fleets fishing in the NEUS LME.
Currently comlandr does not provide estimates of discards
for the USA portion of the data.
The NEUS LME is defined by the following statistical areas and comprises an area = 281702 km2.
- Georges Bank (521, 522, 523, 524, 525, 526, 551, 552, 561, 562)
- Mid Atlantic Bight (537, 539, 600, 612, 613, 614, 615, 616, 621, 622, 625, 626, 631, 632)
- Gulf of Maine (500, 510, 512, 513, 514, 515)
NAFO has different designations for fishing areas. The Divisions that represent the NEUS LME are defined below
- The total reported catch is less that 50% of what is reported by the SAU/Link
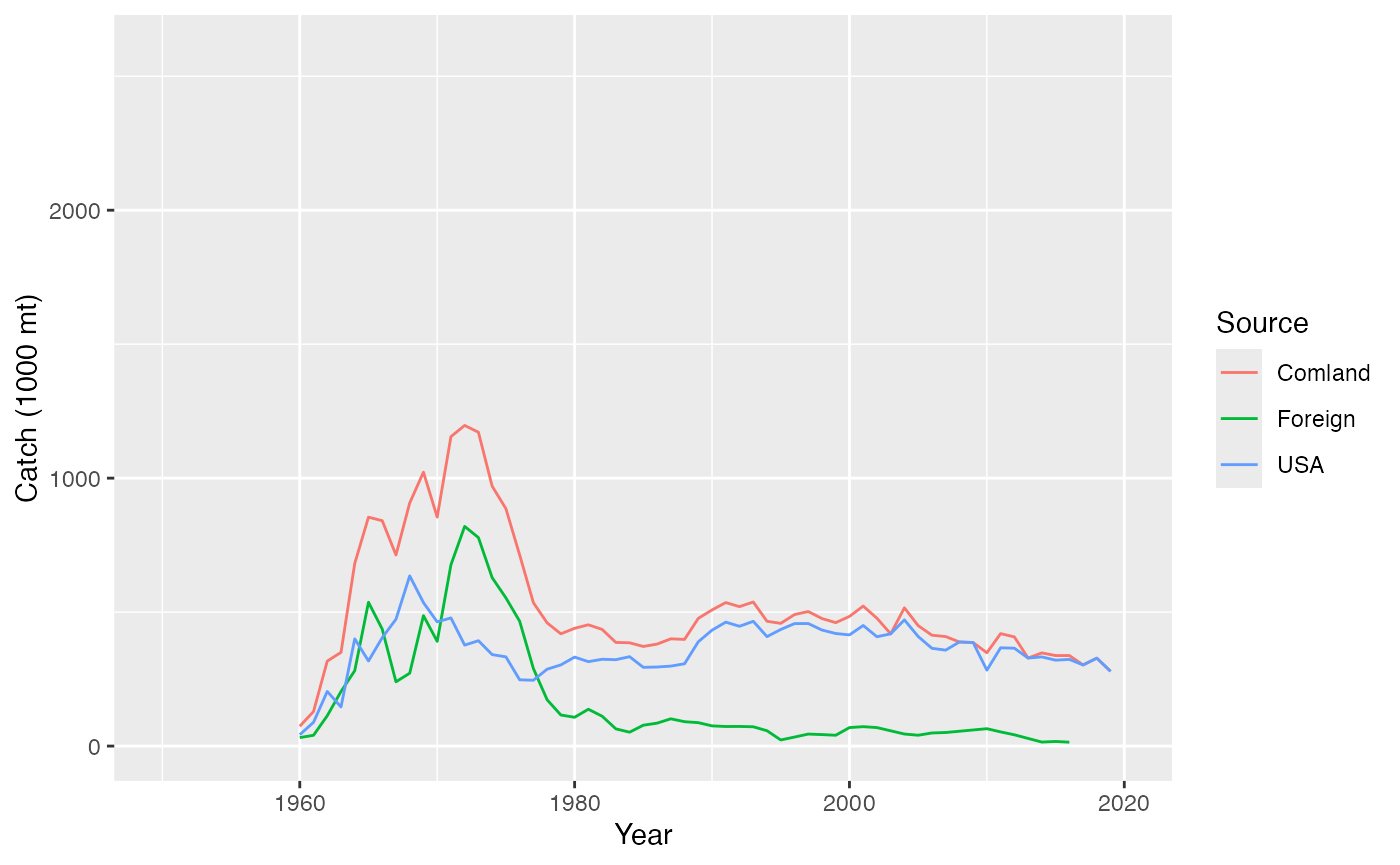
Reported landings (from comlandr) for the NEUS LME separated
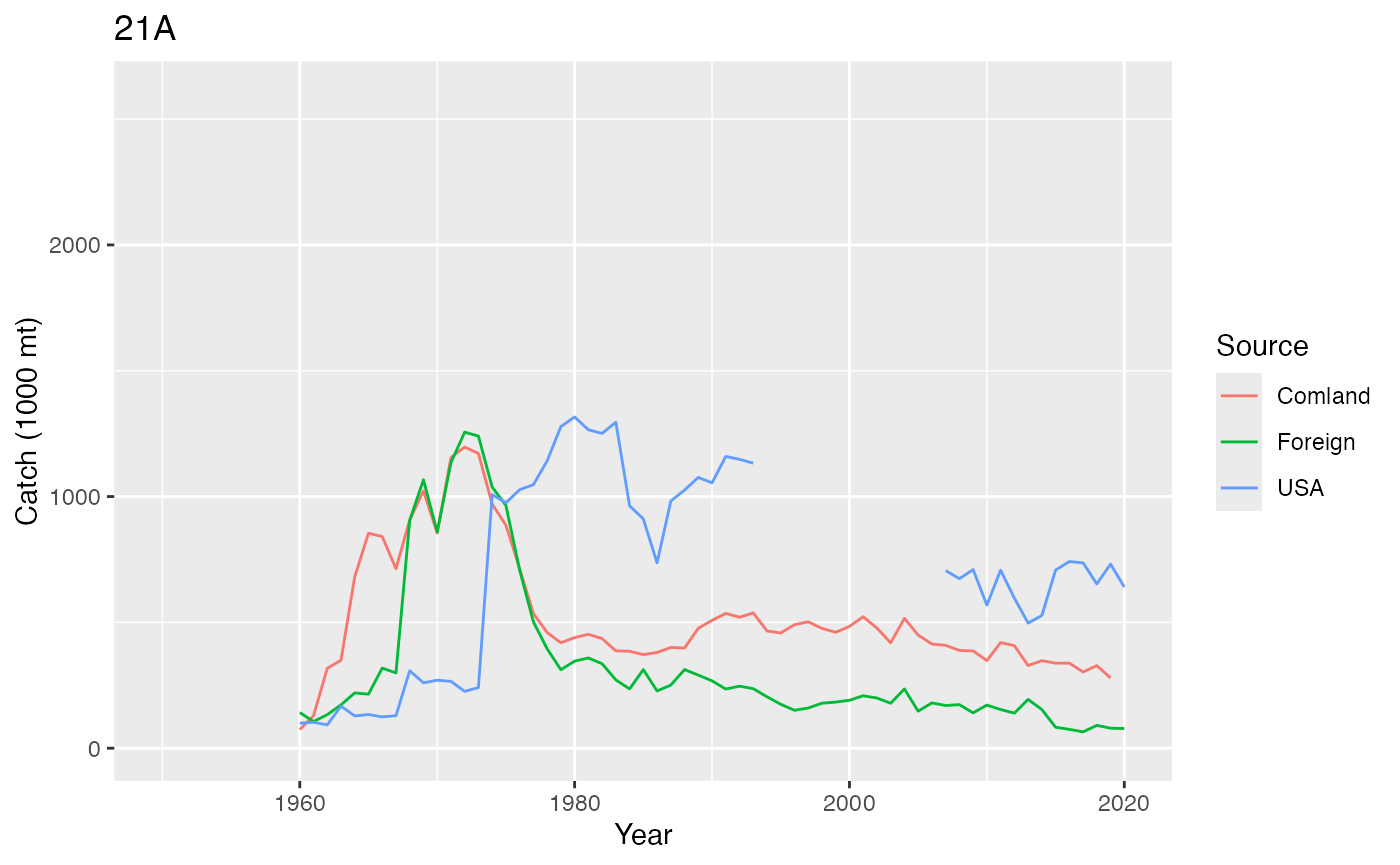
NAFO data US/foreign split
NAFO data contains USA catch until 1994 after which the USA data is considered incomplete since it was reported sparsely. Data are stored in two different databases determined by the level of reporting information. A Comparison of the two databases show that they are almost identical. Data from 21A is used below.
The following division codes we used to represent the NEUS LME
- 47,51,52,53,61,62,63 (Division codes)
- 4X, 5Y, 5ZE, 5ZW, 6A, 6B, 6C (equivalently Zones)
USA reported catch (country code = 22) is separated from foreign catch
- Large discrepancy between
comlandrreported landings and NAFO reported landings for USA. This is partially explained below.
The NAFO foreign catch is also higher than the foreign catch from
comlandr. This needs to be resolved.
NAFO: USA reported landings
What does the composition of the USA portion of the NAFO data look like? The main contributors to the catch are
- Atlantic Menhaden (221)
- American Cupped Oyster (CRASSOSTREA VIRGINICA, Eatern Oyster, 789)
- Blue Crab (700)
- Hard Clam (MERCENARIA MERCENARIA, Northern Clam, 748)
- Ocean Quahog (754)
- Sea Scallop (800)
- Surf clam (769)
Menhaden are a large portion of catch in the NEUS but
comlandr currently doesn’t include them since the data is
managed elsewhere. Some of the shellfish species are possibly being
caught in the Chesapeake bay which is also not accounted for in
comlandr.
This discrepancy needs to be resolved
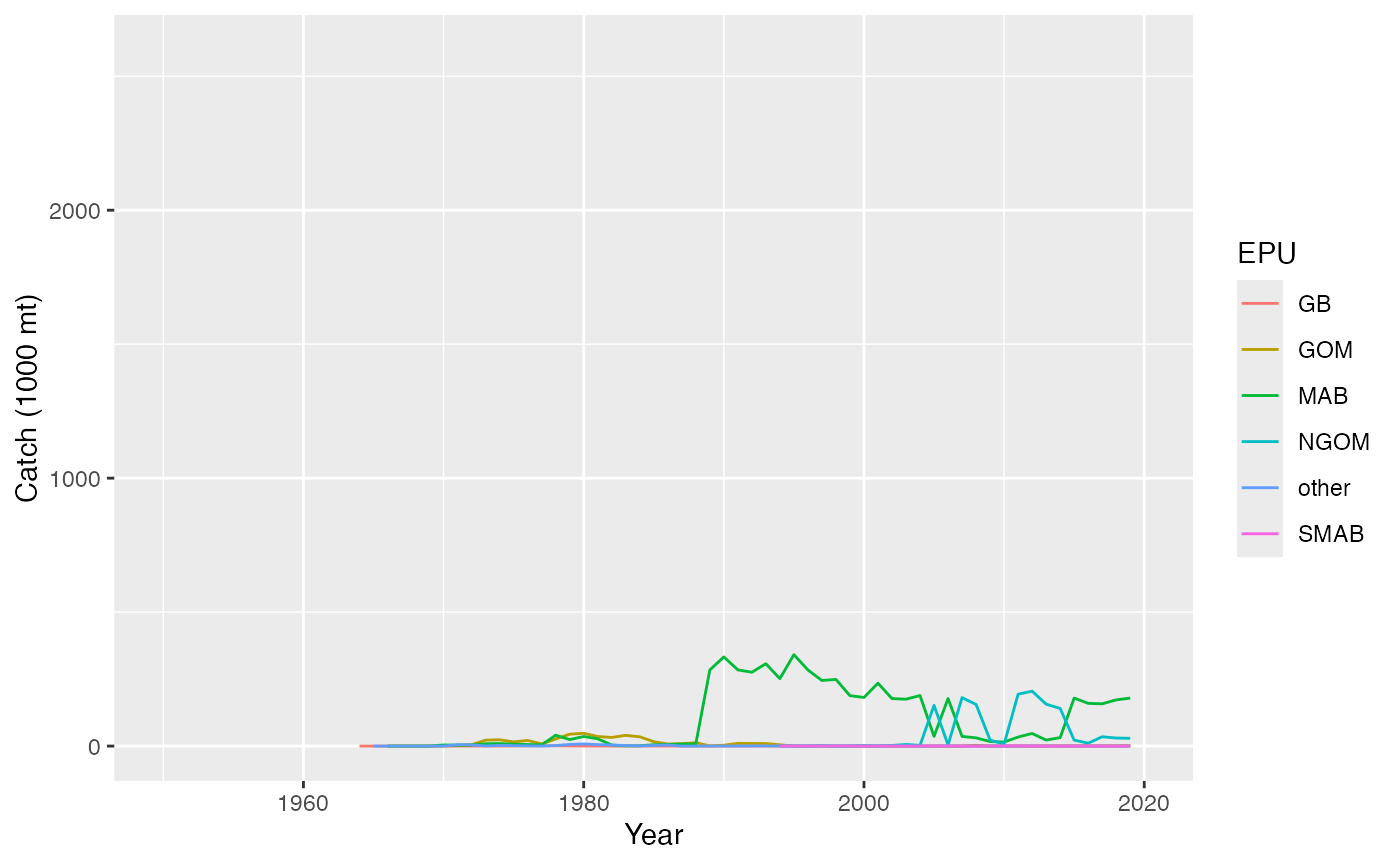
Contribution of species catch by the USA reported to NAFO
Abundance of main contributors in NESFC
Composition of landings of these main NAFO contributors in NEFSC data base
Stocksmart
All data from federally managed species in the Northeast can be
accessed from the Stock
SMART website or via the R package stocksmart.
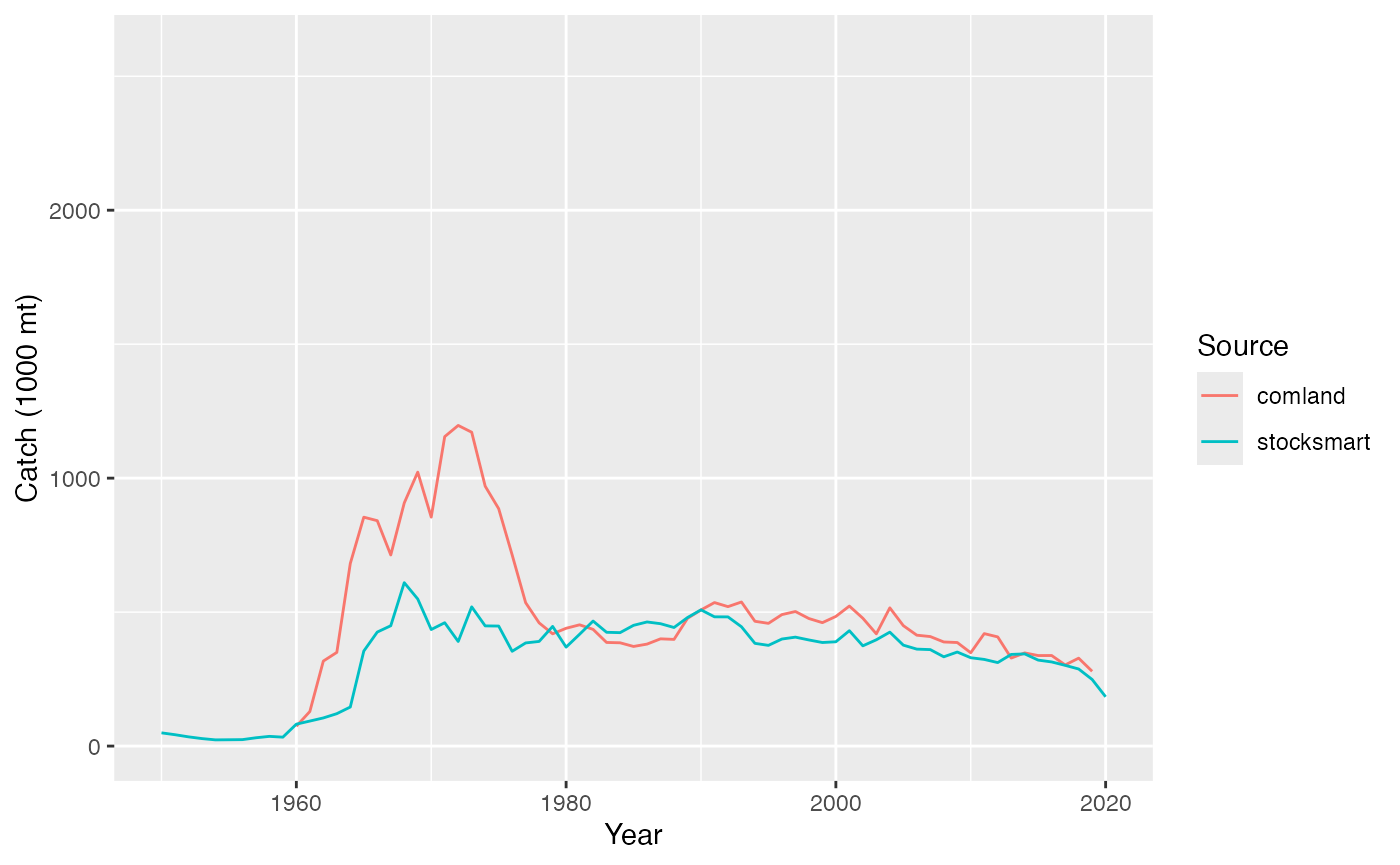
Comparing stock SMART data to comlandr we find an overall
agreement in terms of total Catch.
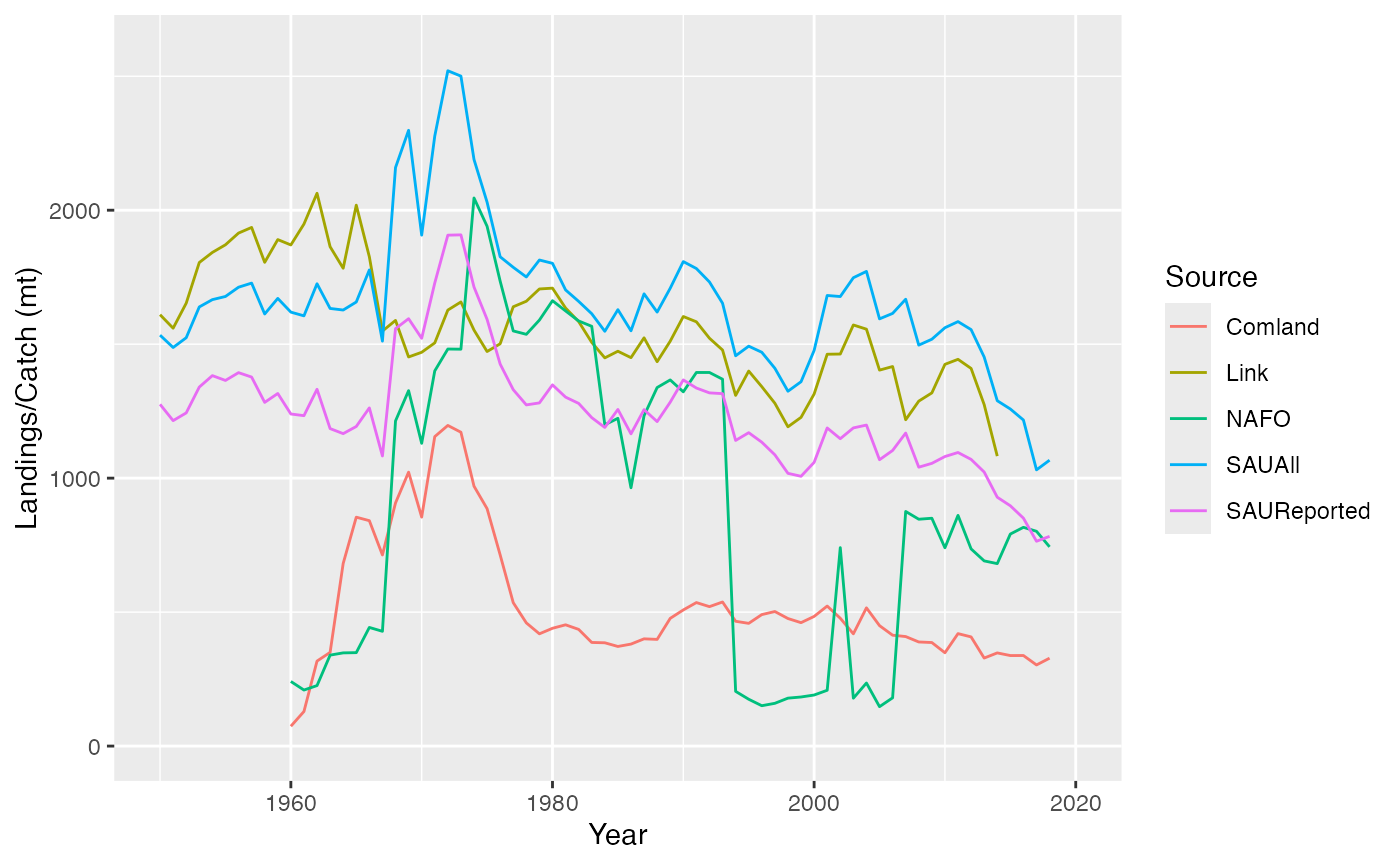
All data sources
To get a better idea of the differences and similarities between the data sources we plot all together.
Note: Link data, SAU data, and NAFO data are estimates of Catch
whereas comlandr data is landings only (no discards)
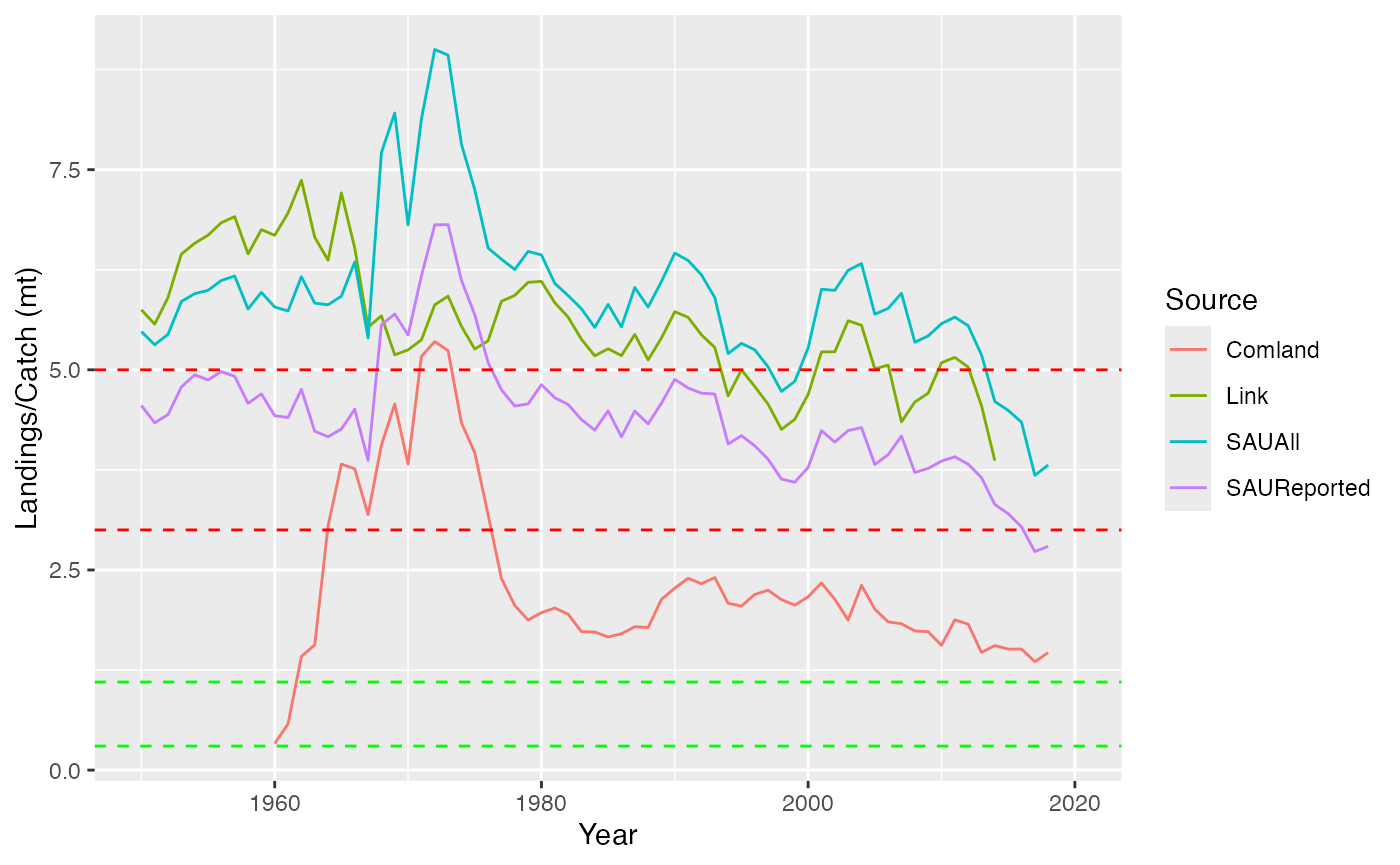
Ecosystem overfishing indices
Several ecosystem overfishing indices (Ryther, Fogarty, Friedland) have been proposed (Link & Watson (2019)) along with specified reference points relating to the health of the system. The implications of incomplete accounting of catch are apparent when assessing ecosystem health using these indices.
For example, the Ryther index is calculated as catch per unit area. Assuming the area of the NEUS LME is approximately 280,000 km2, the following plot demonstrates how ones conclusion regarding ecosystem health will differ depending on the data source.
From Link & Watson (2019): “… to maintain catches at a level above ∼ 3tkm–2 yr–1 (i.e. levels of excessive EOF) requires an incredibly productive ecosystem, which is not sustainable in the long-term”
The estimated percentage of unreported catch from the SAU dataset is applied to comland data estimate to represent total comland catch.
Ultimately, for the NEFSC State of the Ecosystem report these ecosystem overfishing indices will be calculated for multiple sub areas within the NEUS, namely Georges Bank, Gulf of Maine and the Mid Atlantic Bight. Knowing that the estimates of total NEUS catches are in line with other data sources is paramount to the acceptance of the report.
Further work
- How can we streamline adding Menhaden to
comlandr - Why does `comlandr’ not capture all foreign landings from NAFO? Are some species being filtered out?
- Determine the exact differences between the USA landings reported in
comlandrand the USA landings reported in NAFO. - Determine where the additional catch reported by NAFO for the USA is coming from, geographically